AirBnB
Listings Dashboard
Visualization by: Gbolahan Adebayo
Date: September, 2023
Type: Business Dashboard
Link to Visualization: Click Here
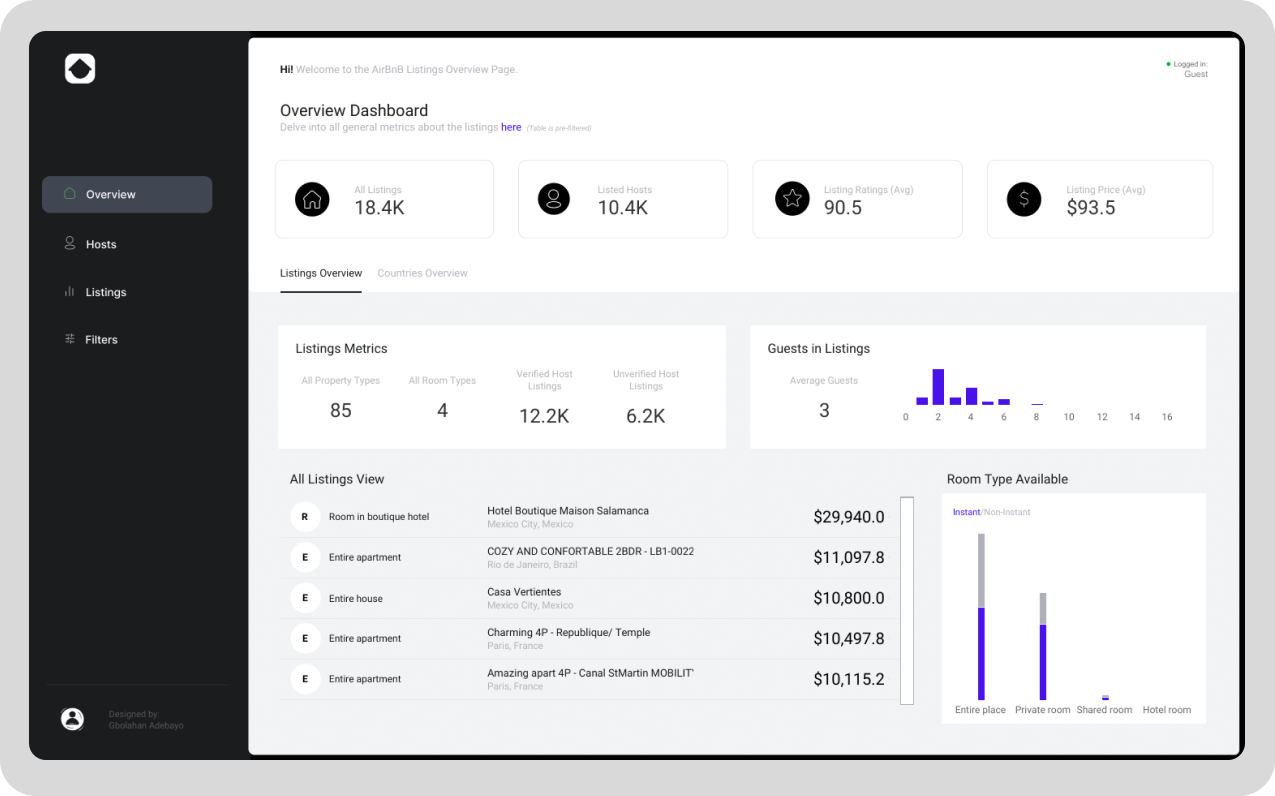
The Airbnb Listings Overview dashboard provides a comprehensive summary of key metrics related to property listings on the platform. At the top, high-level statistics are displayed, including the total number of listings (18.4K), the number of listed hosts (10.4K), the average listing rating (90.5), and the average listing price ($93.5). Below this, the dashboard offers detailed metrics under the “Listings Overview” tab, showing insights such as the total property types (85), room types (4), verified host listings (12.2K), and unverified host listings (6.2K). Additional data visualizations include a bar chart displaying the average number of guests in listings, indicating the distribution of guest capacity across properties.
Another chart highlights room type availability, differentiating between instant booking and non-instant options for various room categories like entire places, private rooms, shared rooms, and hotel rooms. The “All Listings View” table provides a granular look at specific listings, detailing property type, location, and pricing, with examples such as “Casa Vertientes” in Mexico City and multiple apartments in Paris. This dashboard is designed to offer both a high-level and detailed view, enabling stakeholders to analyze and compare property listings efficiently.
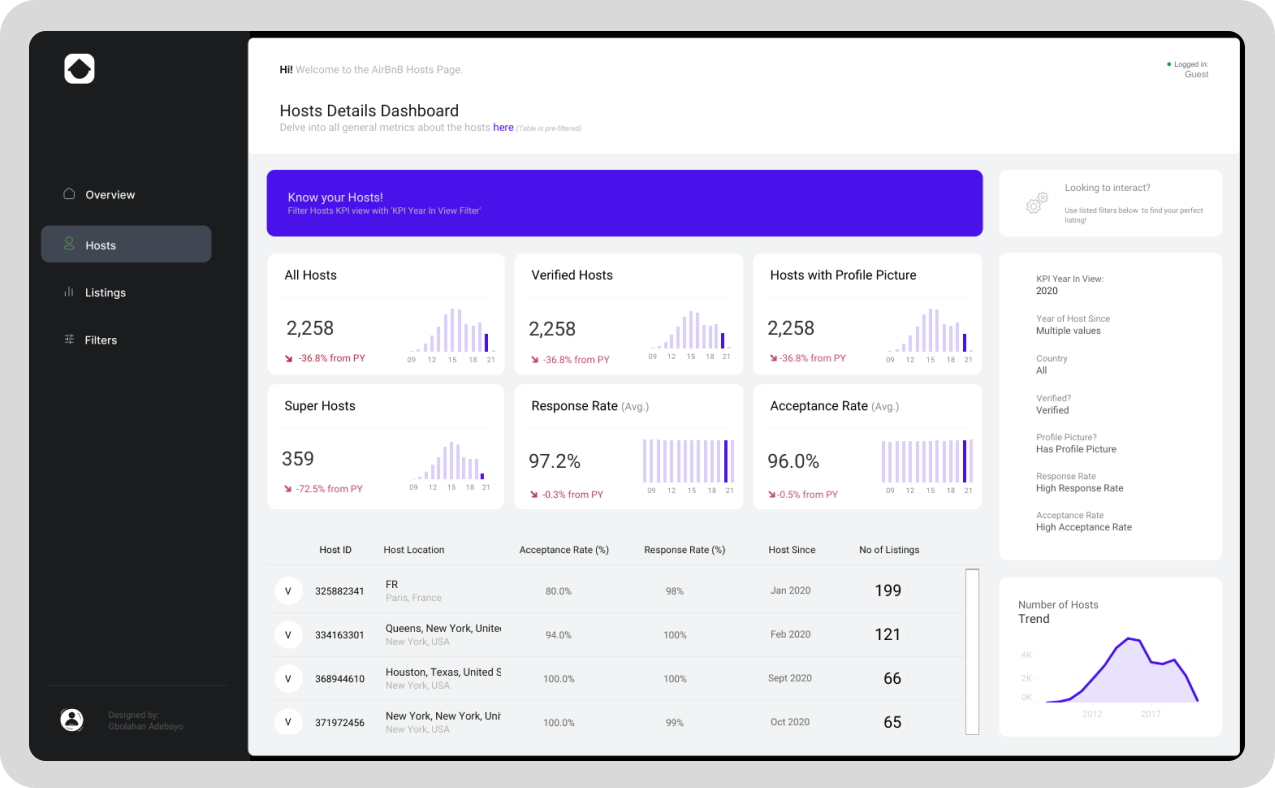
The “Hosts Details Dashboard” provides an in-depth analysis of Airbnb host metrics, focusing on key performance indicators and trends. At the top, high-level metrics summarize the total number of hosts (2,258), verified hosts (2,258), hosts with profile pictures (2,258), super hosts (359), average response rate (97.2%), and average acceptance rate (96%). Each metric includes a percentage change from the previous year (PY), along with historical data visualized through bar charts to track trends over time.
A “Know Your Hosts!” section emphasizes the ability to filter KPI views based on the selected “KPI Year in View.” On the right-hand side, a detailed filtering panel enables users to refine host data based on multiple criteria, such as the year of hosting, country, verification status, profile picture presence, response rate, and acceptance rate. These filters allow for customized exploration of host data to meet specific insights needs.
Below the summary metrics, a table displays granular details for individual hosts, including their Host ID, location, acceptance and response rates, the year they started hosting, and the number of listings they manage. Additionally, a line chart at the bottom right visualizes the trend in the number of hosts over time, offering insights into host growth or decline. This dashboard combines high-level insights with actionable details and interactive filtering, making it an essential tool for analyzing and managing host performance on Airbnb.
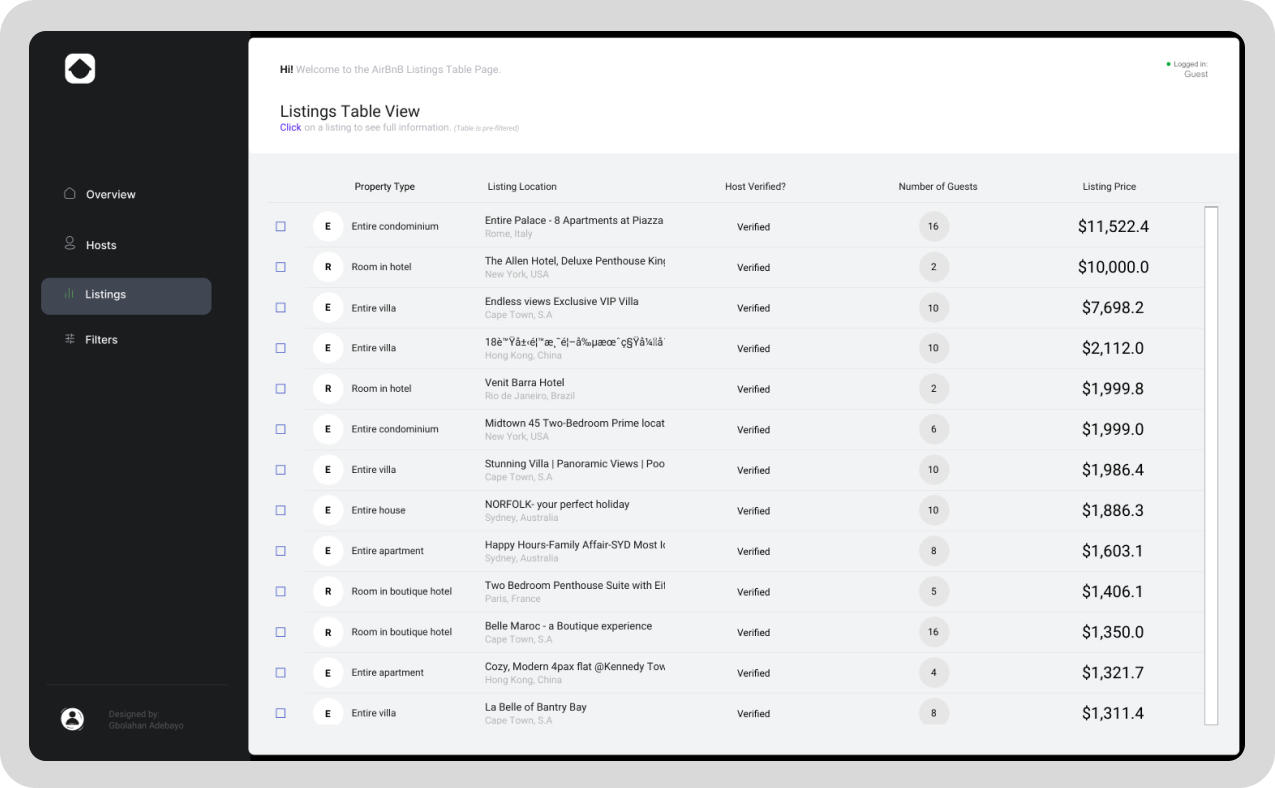
The “Listings Table View” dashboard provides a structured and detailed overview of Airbnb property listings, offering essential data in a tabular format. Key columns include the property type (e.g., entire condominium, entire villa, room in hotel), listing location, verification status, the number of guests accommodated, and the listing price. Each row represents an individual listing, allowing users to quickly scan and compare various properties based on their attributes and pricing.
When a listing is selected, a detailed information panel appears on the right-hand side, presenting additional insights about the chosen property. For example, selecting “Entire Palace - 8 Apartments at Piazza” in Rome, Italy, reveals specific details such as the listing ID, price ($11,522), and property type (entire condominium). It also displays booking attributes like minimum and maximum nights, overall score rating, and the presence of amenities like elevators, breakfast, TV, and more. Furthermore, the host’s information is shown, including their ID, verification status, profile picture, hosting tenure, and performance metrics like response and acceptance rates.
This design seamlessly integrates high-level summaries with granular details, allowing users to filter, explore, and assess listings and hosts with ease. The interactive panel ensures users can dive deeper into individual properties without leaving the main table view, enhancing usability and insight generation.